A client rarely opens a conversation by asking about Interaction to Next Paint. They open it by saying the site "feels slow", or that a competitor’s site "feels snappier", and then it is my job to turn that feeling into a number and the number into a fix. Core Web Vitals are still the best public vocabulary for that conversation, and the specifics worth knowing in 2026 have shifted since the metric set last changed.
This is the practical version: what the three metrics measure, where each one actually breaks on the client sites I audit, and how to prove the fix worked rather than just asserting it.
The three metrics that still matter
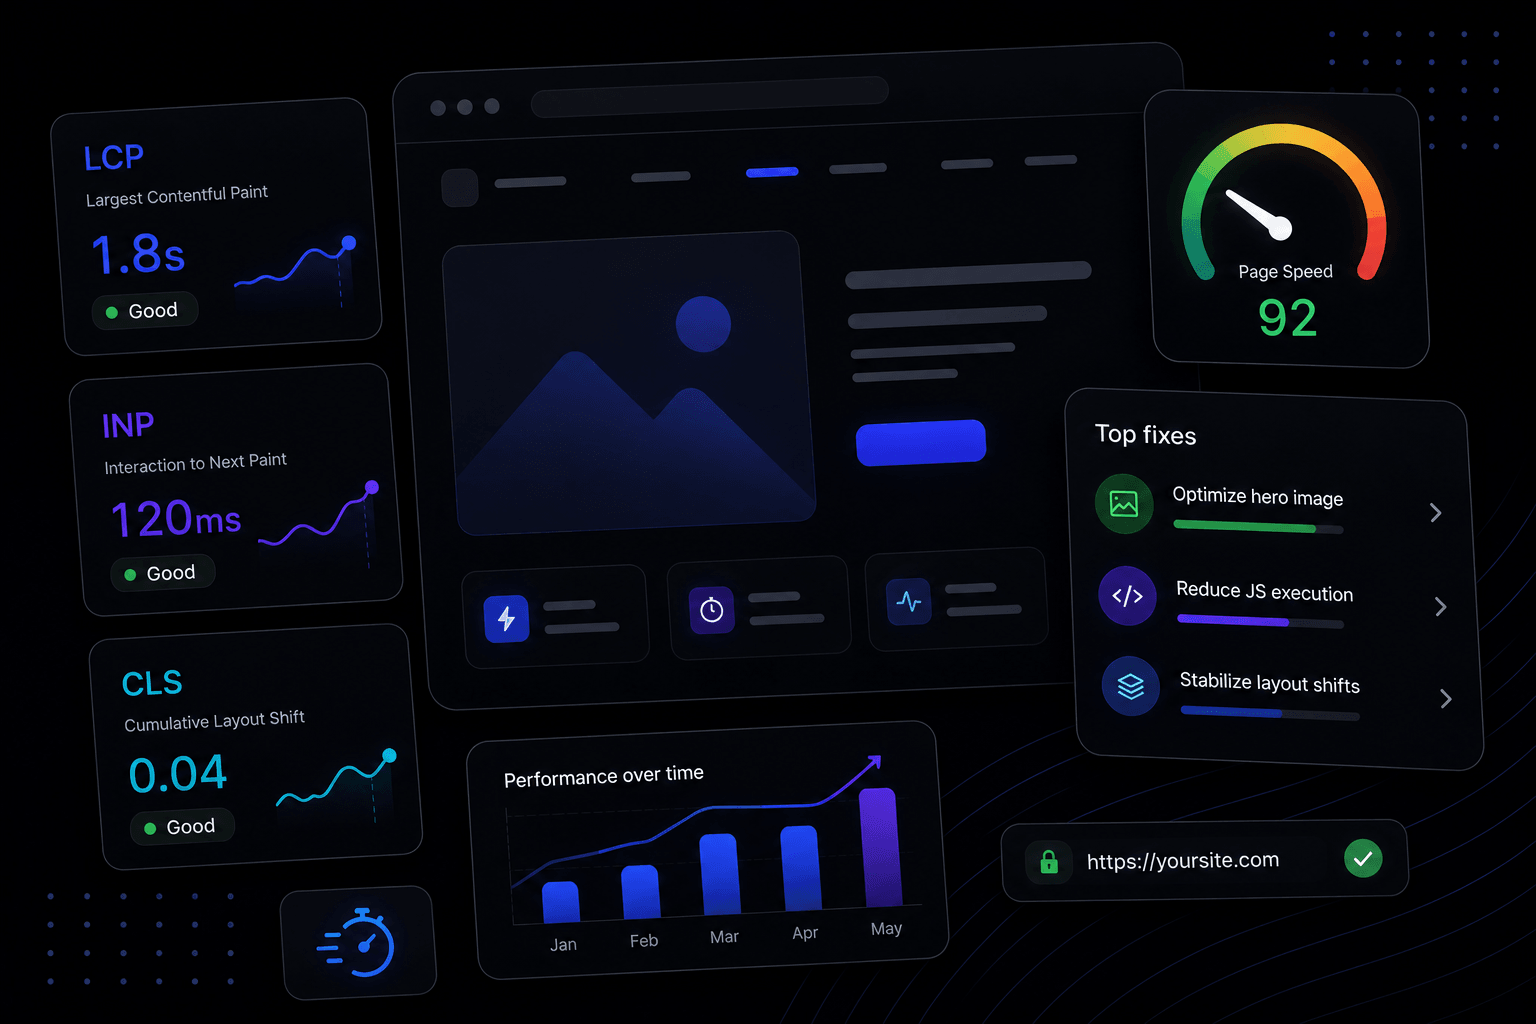
Largest Contentful Paint measures how long the biggest visible element takes to render: the hero image, a headline, a video poster. Under 2.5 seconds is good. Interaction to Next Paint measures the delay between a tap or click and the next visual update, under 200 milliseconds is good, and it replaced First Input Delay as the responsiveness metric because FID only measured the first interaction, not the ones that happen after a page has finished loading and gotten sluggish. Cumulative Layout Shift measures how much visible content jumps around unexpectedly, under 0.1 is good.
All three are pass or fail at the 75th percentile of real visits, not an average and not a lab score. A site that is fast for most visitors and terrible for one in five on a throttled connection still fails the metric, because the threshold is deliberately set to reflect a realistic slower visit, not a top-of-the-range laptop on fibre.
Where LCP actually breaks
On the sites I audit it is almost never the framework. It is an unoptimised hero image shipped at four times the rendered size, a web font blocking text render because it was not preloaded, or a third-party script — a chat widget, an analytics tag, a marketing pixel — loaded synchronously before the content it is supposed to be measuring.
The fix is rarely dramatic: serve the hero at the size it renders at, in a modern format, with high fetch priority and no lazy-loading on the one image guaranteed to be above the fold; preload the font file instead of letting the browser discover it after parsing the CSS; and load every third-party script asynchronously, full stop, unless it has a specific reason to block.
INP is a JavaScript problem
Where LCP is mostly a loading problem, INP is almost entirely a main-thread problem: a long task blocking the browser from responding to a tap, usually caused by too much JavaScript running, hydrating or re-rendering at once. A single component that re-renders an entire long list on every keystroke will fail INP even on a fast connection, because the delay has nothing to do with the network.
The fix that has mattered most on React and Next.js projects this year is being deliberate about what actually needs to be a client component versus what can stay server-rendered, and splitting large client bundles so an interaction on one part of the page is not waiting on JavaScript for an unrelated part to finish executing. Debouncing expensive handlers and virtualising long lists both still earn their keep.
CLS: the cheap fix nobody bothers to make
Layout shift is usually caused by the same three things: an image or video embed with no reserved width and height, a web font that renders at a noticeably different width than the fallback it replaces, and content — usually an ad slot, a cookie banner or a promotional bar — injected above existing content after the page has already laid out.
All three have a fix that costs almost nothing: set explicit dimensions on every image and embed, choose a fallback font metrically close to the web font (or accept a brief flash rather than a shift), and reserve space for anything that injects late instead of letting it push everything below it down the page.
Measuring it right
A Lighthouse score in dev tools is lab data: one run, on one machine, on a fast connection, useful for diagnosing the cause of a problem. It is not the number Google actually judges the page on, which comes from the Chrome User Experience Report: real visits, real devices, real networks, aggregated over 28 days. A page can score 100 in Lighthouse and still fail its Core Web Vitals in the field if enough real visitors are on a mid-range phone on patchy 4G.
Search Console’s Core Web Vitals report and PageSpeed Insights both surface the field data once a site has enough traffic to qualify. For a smaller client site that has not hit the CrUX traffic threshold, I track the same three metrics through a lightweight script in the browser itself, sent to analytics, so the client gets real numbers rather than a lab estimate standing in for them.
Why this still closes deals
Most prospective clients cannot read a Lighthouse report, and they do not need to: they can feel a site that responds instantly to a tap versus one with a beat of lag, and they notice a competitor’s page loading before theirs has finished its layout shift. Performance is one of the few pieces of craft that is directly perceptible without any design vocabulary, which makes it unusually persuasive in a pitch.
It also compounds with the rest of the site: a beautifully designed page that stutters on first load reads as unfinished, and a plain page that responds instantly reads as considered. Speed is not separate from the design work, it is part of what the design is judged on the moment a real visitor opens it.